This was originally posted on Facebook on 10th February 2013
The organizers of the Green Power 50km hike were kind enough to publish a full rank list of finishers here:
Two interesting observations:
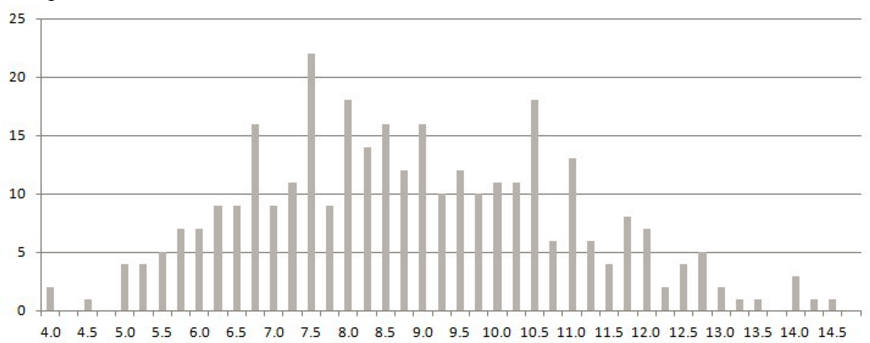
a. One should expect marathon finish times end up being some kind of normal distribution with a long right tail. However GP participants fall largely into 2 distinct categories - those who walk the ups but run the flats and downs vs those who will walk the whole way. This led me to believe that there should be some kind of bi-modality in the distribution - I was not disappointed.
Histogram of finish times in hours (y-axis = number of people who made it)
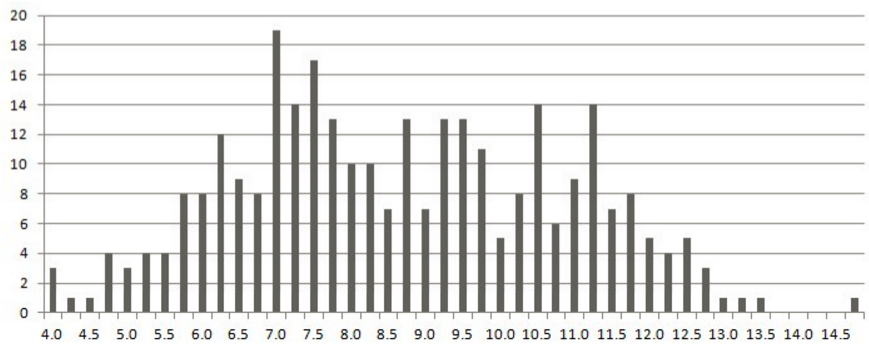
Compare above with a sampling from a bimodal distribution - 50/50 mix of {N(6.75,1.25); N(10.25,1.5)}
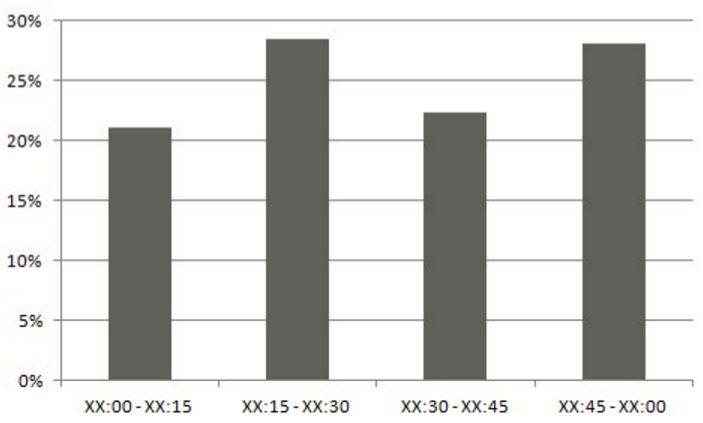
b. There is an additional distortion - I was personally looking to finish under 10 hrs and I found myself adjusting pace towards the end to meet this target - does this work with everyone? If it did we should see more people finish closer to a 30 minute and hour mark as opposed to 15 and 45 minute marks. Here is a breakdown of finishers split into 15 min intra hr buckets revealing that this is indeed the case.